Twin peaks
If you are over forty, the title of this blog will call to mind an iconic, sometimes disturbing, television series of the same name from 1990. If you clicked on the link expecting murder, surreal horror and an undercurrent of sleaze, however, then this posting is as far away from all that as you are ever likely to get: setting capital requirements for life insurers. Take a deep breath to recover from your crushing disappointment and let's get back to the day job…
Insurers in the EU operate under Solvency II, which is a one-year, value-at-risk regulatory regime. The idea is that an insurer needs to hold reserves which will be sufficient to cover 99.5% of adverse scenarios over the coming year and still have enough free capital to be worth buying after a disaster. By making an assumption about the stochastic structure of the risk driving the liability, we can look at a suitably large sample of simulations to see where the 99.5% percentile lies in relation to the median. The results of such an exercise for annuities is shown in Table 1; the ranges for the 99.5th percentile and the capital requirements are the 95% confidence interval based on a sample of 5,000 simulations using the value-at-risk procedure of Richards, Currie & Ritchie (2012).
Table 1. Value-at-risk capital requirements for annuities payable to male 70-year-olds at outset in 2015 under various stochastic mortality models. Source: Table 4, RIchards, Currie, Kleinow and Ritchie (2017).
| Annuity value: | Capital | ||
|---|---|---|---|
| Model | Median | 99.5th percentile | requirement |
| Age-Period | 13.696 | 14.263–14.317 | 4.14%–4.54% |
| Age-Period-Cohort (APC) | 14.993 | 15.192–15.316 | 1.33%–2.15% |
| Lee-Carter | 13.447 | 13.740–13.832 | 2.18%–2.86% |
| APCI | 13.692 | 14.246–14.253 | 4.05%–4.10% |
Table 1 demonstrates the well-known phenomenon of model risk, i.e. different models produce different central estimates and also different capital requirements. Indeed, the central estimate under the APC model actually lies above the 99.5th percentile of the other three models. Despite this, the APC model produces the smallest capital requirements of the four models. To understand what drives all these observations, it is helpful to plot the densities for the annuity factors behind the calculations in Table 1; this is done in Figure 1.
Figure 1: Densities for annuity values in Table 1. The dashed lines are the medians and the dotted lines are the 99.5th percentiles; the lines are of height 1 to illustrate kurtosis. Source: Figure 12, Richards, Currie, Kleinow & Ritchie (2017).
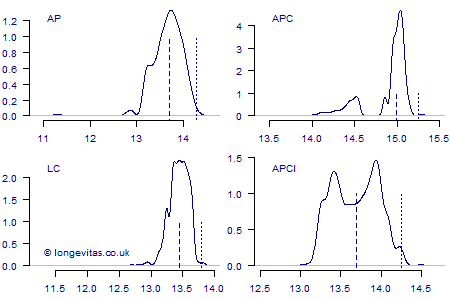
Figure 1 is instructive, as no density has the neat, well-behaved shape of the likes of the normal distribution. Both the Age-Period and Lee-Carter densities are essentially unimodal, albeit with the occasional outlier on the left. The Lee-Carter density is leptokurtic, however, which causes the 99.5th percentile to be close to the median and results in lower capital requirements compared to the Age-Period model.
In contrast, the APC and APCI models both produce bimodal densities. In the case of the APC model, the lesser mode is some way to the left of the main mode. The main peak is strongly leptokurtic, however, which causes the 99.5th percentile to be very close to the median and results in the lowest capital requirements of all the four models. The APCI model also produces a bimodal density, but this time it is nearly symmetric in shape, resulting in the median sitting in between the two peaks. Although this perhaps looks odd, it is not of itself the cause of the higher capital requirements compared to the APC model; after all, the APC model also has a bimodal density. Instead, the capital requirements under the APCI model are driven by the relative flatness of the density: in technical terms it is platykurtic, which — as with the Age-Period density — leads to high capital requirements.
As we see so often with mortality projections, the choice of model can have a large impact on the final results. In this example, the most visually striking of density features — the bimodal shape — turned out not to be the main driver of differences in capital requirements. Each model has its own unusual features, so it is essential that insurers use multiple different models when setting regulatory capital requirements. Of course, if you already use lots of different stochastic projection models for longevity work, now would be a good time to reward yourself with a fine cup of coffee.
References:
Richards, S. J., Currie, I. D. and Ritchie, G. P. (2014) A value-at-risk framework for longevity trend risk, British Actuarial Journal, Volume 19, Part 1, 116–167 (with discussion).
Richards, S. J., Currie, I. D., Kleinow, T. and Ritchie, G. P. (2017) A stochastic implementation of the APCI model for mortality projections, Longevitas working paper.
Add new comment